import numpy as np
import matplotlib.pyplot as plt
def linclass(mupos=None, sigpos=None, rhopos=None, muneg=None, signeg=None, rhoneg=None):
if mupos is None:
mupos = np.array([1, 1])
sigpos = np.array([0.4, 0.4])
rhopos = 0.2
muneg = np.array([-1, -1])
signeg = np.array([0.4, 0.4])
rhoneg = -0.2
covpos = rhopos * np.sqrt(sigpos[0] * sigpos[1])
sigmapos = np.array([[sigpos[0], covpos], [covpos, sigpos[1]]])
covneg = rhoneg * np.sqrt(signeg[0] * signeg[1])
sigmaneg = np.array([[signeg[0], covneg], [covneg, signeg[1]]])
Npos = 100
Nneg = 50
pos = np.random.multivariate_normal(mupos, sigmapos, Npos)
neg = np.random.multivariate_normal(muneg, sigmaneg, Nneg)
plt.figure(figsize=(8, 8))
plt.xlim([-3, 3])
plt.ylim([-3, 3])
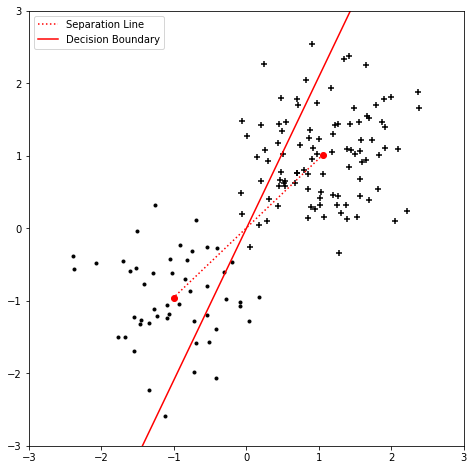
plt.scatter(pos[:, 0], pos[:, 1], color='k', marker='+')
plt.scatter(neg[:, 0], neg[:, 1], color='k', marker='.')
plt.gca().set_aspect('equal', adjustable='box')
pos1 = np.hstack([np.ones((Npos, 1)), pos])
neg1 = np.hstack([np.ones((Nneg, 1)), neg])
emupos1 = np.mean(pos1, axis=0)
emuneg1 = np.mean(neg1, axis=0)
plt.plot(emupos1[1], emupos1[2], 'ro')
plt.plot(emuneg1[1], emuneg1[2], 'ro')
plt.plot([emupos1[1], emuneg1[1]], [emupos1[2], emuneg1[2]], 'r:', label='Separation Line')
blc = emupos1 - emuneg1
x_vals = np.array([-2, 2])
y_vals = (-blc[0] + x_vals * 2 * blc[1]) / blc[2]
plt.plot(x_vals, y_vals, 'r-', label='Decision Boundary')
plt.legend()
plt.show()
linclass()