import numpy as np
import matplotlib.pyplot as plt
mupos = [1, 1]
sigpos = [0.1, 0.6]
rhopos = 0.1
mupos2 = [-1, -1]
sigpos2 = [0.2, 0.2]
rhopos2 = 0
muneg = [1, -1]
signeg = [0.6, 0.1]
rhoneg = 0.1
muneg2 = [-1, 1]
signeg2 = sigpos2
rhoneg2 = rhopos2
covpos = rhopos * np.sqrt(sigpos[0] * sigpos[1])
sigmapos = np.array([[sigpos[0], covpos], [covpos, sigpos[1]]])
covpos2 = rhopos2 * np.sqrt(sigpos2[0] * sigpos2[1])
sigmapos2 = np.array([[sigpos2[0], covpos2], [covpos2, sigpos2[1]]])
covneg = rhoneg * np.sqrt(signeg[0] * signeg[1])
sigmaneg = np.array([[signeg[0], covneg], [covneg, signeg[1]]])
covneg2 = rhoneg2 * np.sqrt(signeg2[0] * signeg2[1])
sigmaneg2 = np.array([[signeg2[0], covneg2], [covneg2, signeg2[1]]])
Npos = 25
Npos2 = 10
Nneg = 25
Nneg2 = 10
pos = np.vstack([np.random.multivariate_normal(mupos, sigmapos, Npos - Npos2),
np.random.multivariate_normal(mupos2, sigmapos2, Npos2)])
neg = np.vstack([np.random.multivariate_normal(muneg, sigmaneg, Nneg - Nneg2),
np.random.multivariate_normal(muneg2, sigmaneg2, Nneg2)])
N = Npos + Nneg
pi0 = Npos / N
pi1 = Nneg / N
xy = np.vstack([pos, neg])
xmin, xmax = np.min(xy[:, 0]), np.max(xy[:, 0])
ymin, ymax = np.min(xy[:, 1]), np.max(xy[:, 1])
xymin = [xmin, ymin]
xymax = [xmax, ymax]
T = 5
blc = np.zeros((T, 2))
x0blc = np.zeros((T, 2))
weight = np.ones(N)
alpha = np.zeros(T)
for t in range(T):
weight = weight / np.sum(weight)
weightedmeanpos = np.dot(weight[:Npos], pos) / np.sum(weight[:Npos])
weightedmeanneg = np.dot(weight[Npos:], neg) / np.sum(weight[Npos:])
blc[t, :] = weightedmeanpos - weightedmeanneg
x0blc[t, :] = (weightedmeanpos + weightedmeanneg) / 2
pred = np.sign(np.dot(xy - np.tile(x0blc[t], (N, 1)), blc[t, :]))
error = 0
for i in range(Npos):
if pred[i] == -1:
error += weight[i]
for i in range(Npos, N):
if pred[i] == 1:
error += weight[i]
if error >= 0.5:
break
for i in range(Npos):
if pred[i] == -1:
weight[i] = weight[i] / (2 * error)
else:
weight[i] = weight[i] / (2 * (1 - error))
for i in range(Npos, N):
if pred[i] == 1:
weight[i] = weight[i] / (2 * error)
else:
weight[i] = weight[i] / (2 * (1 - error))
alpha[t] = 0.5 * np.log((1 - error) / error)
votes = np.zeros(N)
for t in range(T):
votes += alpha[t] * np.sign(np.dot(xy - np.tile(x0blc[t], (N, 1)), blc[t, :]))
Lb = (np.sign(votes) + 1) / 2
boostederror = (np.sum(Lb[:Npos] == 0) + np.sum(Lb[Npos:] == 1)) / N
Lb2 = (np.sign(votes + np.sum(alpha) * (1 - 2 * np.random.rand(N))) + 1) / 2
boostederror2 = (np.sum(Lb2[:Npos] == 0) + np.sum(Lb2[Npos:] == 1)) / N
Ntest = 50000
Te = np.tile(xymin, (Ntest, 1)) + np.tile(np.array(xymax) - np.array(xymin), (Ntest, 1)) * np.random.rand(Ntest, 2)
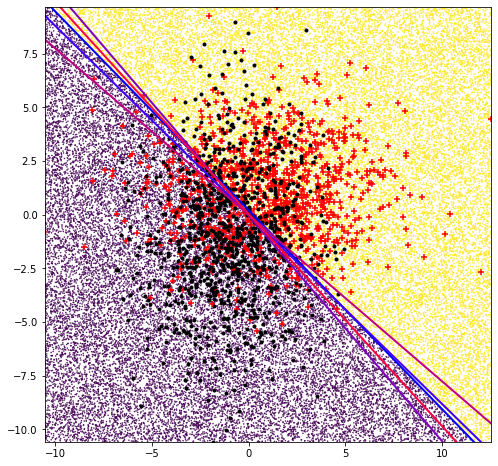
plt.figure(1)
plt.axis([xmin, xmax, ymin, ymax])
votes = np.zeros(Ntest)
for t in range(T):
if alpha[t] == 0:
break
yleft = -(blc[t, 0] / blc[t, 1]) * (xmin - x0blc[t, 0]) + x0blc[t, 1]
yright = -(blc[t, 0] / blc[t, 1]) * (xmax - x0blc[t, 0]) + x0blc[t, 1]
color = np.clip([(t - 1) / (T - 1), 0, (T - t) / (T - 1)], 0, 1)
plt.plot([xmin, xmax], [yleft, yright], linestyle='-', color=color, linewidth=2)
votes += alpha[t] * np.sign(np.dot(Te - np.tile(x0blc[t], (Ntest, 1)), blc[t, :]))
Lb = (np.sign(votes) + 1) / 2
plt.scatter(Te[:, 0], Te[:, 1], s=1, c=Lb)
plt.scatter(pos[:, 0], pos[:, 1], color='r', marker='+')
plt.scatter(neg[:, 0], neg[:, 1], color='k', marker='.')
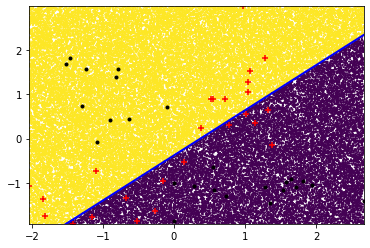
plt.figure(2)
plt.axis([xmin, xmax, ymin, ymax])
for t in range(T):
if alpha[t] == 0:
break
yleft = -(blc[t, 0] / blc[t, 1]) * (xmin - x0blc[t, 0]) + x0blc[t, 1]
yright = -(blc[t, 0] / blc[t, 1]) * (xmax - x0blc[t, 0]) + x0blc[t, 1]
color = np.clip([(t - 1) / (T - 1), 0, (T - t) / (T - 1)], 0, 1)
plt.plot([xmin, xmax], [yleft, yright], linestyle='-', color=color, linewidth=2)
Lb2 = (np.sign(votes + np.sum(alpha) * (1 - 2 * np.random.rand(Ntest))) + 1) / 2
plt.scatter(Te[:, 0], Te[:, 1], s=1, c=Lb2)
plt.scatter(pos[:, 0], pos[:, 1], color='r', marker='+')
plt.scatter(neg[:, 0], neg[:, 1], color='k', marker='.')
plt.show()