6.1 Impurity Rule
import matplotlib.pyplot as plt
import numpy as np
c = 1 / 2
pos = c * 100
neg = 100
def entropy(P, N):
if P == 0 or N == 0:
return 0
p = P / (P + N)
n = N / (P + N)
return -p * np.log2(p) - n * np.log2(n)
def gini(P, N):
p = P / (P + N)
n = N / (P + N)
return 2 * p * n
def dkm(P, N):
return np.sqrt(gini(P, N))
def minacc(P, N):
p = P / (P + N)
n = N / (P + N)
return min(p, n)
def metric(tp, fp, m):
if tp + fp == 0:
return 0
Pos = pos
Neg = neg
N = Pos + Neg
TP = tp
FP = fp
FN = Pos - TP
TN = Neg - FP
if m == 'accuracy': return (TP + TN) / N
if m == 'wracc': return TP / N - (TP + FP) * (TP + FN) / N**2
if m == 'confirmation':
A = (TP + FP) * (FP + TN) / N**2
B = FP / N
C = np.sqrt((TP + FP) * (FP + TN) / N**2)
return (A - B) / (C - A)
if m == 'generality': return (TP + FP) / N
if m == 'precision': return TP / (TP + FP)
if m == 'laplace-precision': return (TP + 1) / (TP + FP + 2)
if m == 'f-measure': return 2 * TP / (2 * TP + FP + FN)
if m == 'g-measure': return TP / (FP + Pos)
if m == 'precision*recall': return TP**2 / ((TP + FP) * (TP + FN))
if m == 'avg-precision-recall': return TP / (2 * (TP + FP)) + TP / (2 * (TP + FN))
if m == 'aucsplit': return (TP * Neg + Pos * TN) / (2 * Pos * Neg)
if m == 'balanced-aucsplit': return TP / Pos - FP / Neg
if m == 'chi2':
return (TP * TN - FP * FN)**2 / ((TP + FP) * (TP + FN) * (FP + TN) * (FN + TN))
if m == 'info-gain':
return entropy(Pos, Neg) - (TP + FP) / N * entropy(TP, FP) - (FN + TN) / N * entropy(FN, TN)
if m == 'gini':
return gini(Pos, Neg) - (TP + FP) / N * gini(TP, FP) - (FN + TN) / N * gini(FN, TN)
if m == 'dkm':
return dkm(Pos, Neg) - (TP + FP) / N * dkm(TP, FP) - (FN + TN) / N * dkm(FN, TN)
if m == 'entropy': return entropy(TP, FP) / 2
if m == 'giniimp': return gini(TP, FP)
if m == 'dkmimp': return dkm(TP, FP)
if m == 'minacc': return minacc(TP, FP)
x = np.arange(0, neg + 1)
y = np.arange(0, pos + 1)
X, Y = np.meshgrid(x, y)
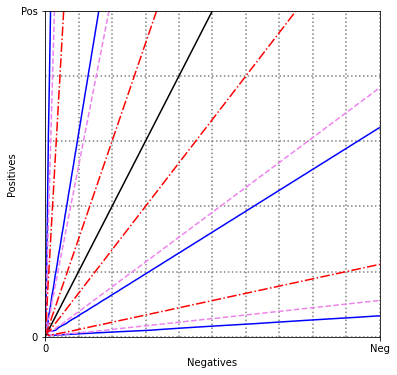
def rocgrid():
plt.figure(figsize=(6, 6))
plt.xlim(0, neg)
plt.ylim(0, pos)
plt.xlabel("Negatives")
plt.ylabel("Positives")
plt.xticks([0, neg], ['0', 'Neg'])
plt.yticks([0, pos], ['0', 'Pos'])
plt.gca().set_aspect('auto')
for gx in np.arange(0, neg + 1, 10):
plt.axvline(x=gx, color='gray', linestyle='dotted')
for gy in np.arange(0, pos + 1, 10):
plt.axhline(y=gy, color='gray', linestyle='dotted')
slope = pos / (c * neg)
x_vals = np.array([0, neg])
plt.plot(x_vals, slope * x_vals, linestyle='solid', color='black')
def compute_z(m):
z = np.zeros_like(X, dtype=float)
for i in range(X.shape[0]):
for j in range(X.shape[1]):
z[i, j] = metric(Y[i, j], X[i, j], m)
return z
def contour2(m, col, lty, levels):
Z = compute_z(m)
plt.contour(X, Y, Z, levels=levels, colors=col, linestyles=lty)
p1 = c * 80
n1 = 20
p2 = c * 100
n2 = 60
rocgrid()
values = [0.1, 0.4]
contour2('entropy', 'blue', 'solid', values)
contour2('giniimp', 'violet', 'dashed', values)
contour2('minacc', 'red', 'dashdot', values)
plt.show()
6.2 Rule list
import matplotlib.pyplot as plt
import numpy as np
import math

c = 1
pos = c * 50
neg = 75

def rocgrid():
    plt.figure(figsize=(6, 6))
    plt.xlim(0, neg)
    plt.ylim(0, pos)
    plt.xlabel("Negatives")
    plt.ylabel("Positives")
    plt.xticks([])
    plt.yticks([])
    plt.gca().set_aspect('equal')
    plt.grid(True, which='both', color='gray', linestyle='-', linewidth=0.5)
    plt.minorticks_on()

def entropy(P, N):
    if P == 0 or N == 0:
        return 0
    p = P / (P + N)
    n = N / (P + N)
    return -p * math.log2(p) - n * math.log2(n)

def gini(P, N):
    p = P / (P + N)
    n = N / (P + N)
    return 4 * p * n

def dkm(P, N):
    p = P / (P + N)
    n = N / (P + N)
    return 2 * math.sqrt(p * n)

def minacc(P, N):
    p = P / (P + N)
    n = N / (P + N)
    return min(p, n)

def metric(tp, fp, m):
    if tp + fp == 0:
        return 0
    Pos = pos
    Neg = neg
    N = Pos + Neg
    TP = tp
    FP = fp
    FN = Pos - TP
    TN = Neg - FP

    if m == 'accuracy':
        return (TP + TN) / N
    if m == 'wracc':
        return TP / N - (TP + FP) * (TP + FN) / N**2
    if m == 'confirmation':
        num = (TP + FP) * (FP + TN) / N**2 - FP / N
        den = math.sqrt((TP + FP) * (FP + TN) / N**2) - (TP + FP) * (FP + TN) / N**2
        return num / den if den != 0 else 0
    if m == 'generality':
        return (TP + FP) / N
    if m == 'precision':
        return TP / (TP + FP)
    if m == 'laplace-precision':
        return (TP + 10) / (TP + FP + 20)
    if m == 'f-measure':
        return 2 * TP / (2 * TP + FP + FN)
    if m == 'g-measure':
        return TP / (FP + Pos)
    if m == 'precision*recall':
        return TP**2 / ((TP + FP) * (TP + FN))
    if m == 'avg-precision-recall':
        return TP / (2 * (TP + FP)) + TP / (2 * (TP + FN))
    if m == 'aucsplit':
        return (TP * Neg + Pos * TN) / (2 * Pos * Neg)
    if m == 'balanced-aucsplit':
        return TP / Pos - FP / Neg
    if m == 'chi2':
        return ((TP * TN - FP * FN)**2) / ((TP + FP) * (TP + FN) * (FP + TN) * (FN + TN))
    if m == 'info-gain':
        return entropy(Pos, Neg) - (TP + FP) / N * entropy(TP, FP) - (FN + TN) / N * entropy(FN, TN)
    if m == 'gini':
        return gini(Pos, Neg) - (TP + FP) / N * gini(TP, FP) - (FN + TN) / N * gini(FN, TN)
    if m == 'dkm':
        return dkm(Pos, Neg) - (TP + FP) / N * dkm(TP, FP) - (FN + TN) / N * dkm(FN, TN)
    if m == 'entropy':
        return entropy(TP, FP) / 2
    if m == 'giniimp':
        return gini(TP, FP)
    if m == 'dkmimp':
        return dkm(TP, FP)
    if m == 'minacc':
        return minacc(TP, FP)

def contour1(m, col, lty, tp, fp):
    v = metric(tp, fp, m)
    col_val = (min(2 - 2 * v, 1), v, 0)
    color = (col_val[0], col_val[1], col_val[2])
    plt.plot(fp, tp, 'o', color=color, linewidth=3)
    if tp == 0 or fp == 0:
        plt.plot([0, fp], [0, tp], color=color, linestyle=lty, linewidth=4)
        return
    x = np.arange(0, fp + 1)
    y = np.arange(0, tp + 1)
    X, Y = np.meshgrid(x, y)
    Z = np.vectorize(lambda tp, fp: metric(tp, fp, m))(Y, X)
    plt.contour(X, Y, Z, levels=[v], linewidths=2, colors=[color], linestyles=[lty])

rocgrid()
d = 1
method = 'precision'
colour = 'black'
p = 0
n = 40

plt.arrow(50 - d, 50 - d, n + d - (50 - d), p + d - (50 - d), color='violet', width=0.2, head_width=1.5)

contour1(method, 'red', 'solid', p, n)
contour1(method, colour, 'dotted', 10, 30)
contour1(method, colour, 'dotted', 20, 20)
contour1(method, 'green', 'solid', 20, 0)
contour1(method, colour, 'dotted', 50, 10)
contour1(method, colour, 'dotted', 50, 30)
contour1(method, 'red', 'solid', 0, 20)
contour1(method, colour, 'dotted', 30, 40)
contour1(method, colour, 'dotted', 20, 10)

plt.show()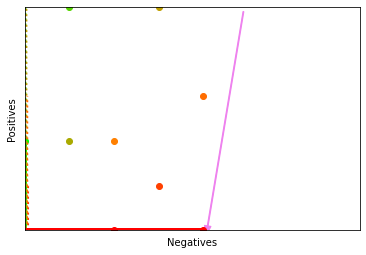
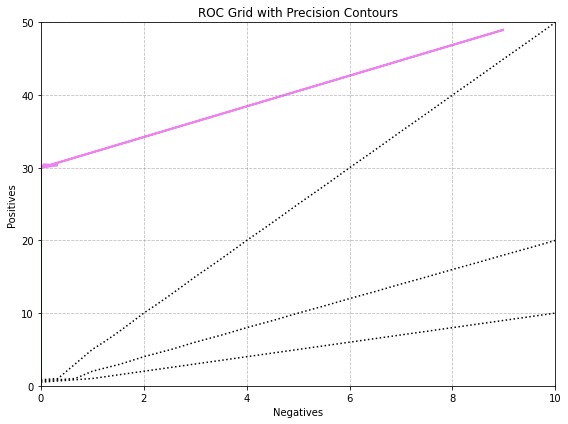
6.3 Rule list 2
import numpy as np
import matplotlib.pyplot as plt

pos = 50
neg = 10

def precision(tp, fp):
    return tp / (tp + fp) if (tp + fp) > 0 else 0

def compute_metric_grid(metric_func, pos, neg):
    x = np.arange(0, neg + 1)
    y = np.arange(0, pos + 1)
    z = np.zeros((len(y), len(x)))
    for i, tp in enumerate(y):
        for j, fp in enumerate(x):
            z[i, j] = metric_func(tp, fp)
    return x, y, z

def draw_plot():
    fig, ax = plt.subplots(figsize=(8, 6))
    ax.set_xlim(0, neg)
    ax.set_ylim(0, pos)
    ax.set_xlabel('Negatives')
    ax.set_ylabel('Positives')
    ax.grid(True, which='both', linestyle='--', color='gray', alpha=0.5)

    p, n = 30, 0
    ax.arrow(neg - 1, pos - 1, n - (neg - 1), p - (pos - 1),
             color='violet', head_width=0.3, length_includes_head=True, linewidth=2)

    def draw_contour(tp, fp, color, style='solid'):
        v = precision(tp, fp)
        if tp == 0 or fp == 0:
            ax.plot([0, fp], [0, tp], color=color, linestyle=style, linewidth=1)
            return
        sub_pos = tp
        sub_neg = fp
        x, y, z = compute_metric_grid(precision, sub_pos, sub_neg)
        cs = ax.contour(x, y, z, levels=[v], colors=[color], linestyles=[style])

    draw_contour(30, 0, 'green')
    draw_contour(20, 0, 'green')
    draw_contour(10, 10, 'black', 'dotted')
    draw_contour(50, 10, 'black', 'dotted')
    draw_contour(20, 10, 'black', 'dotted')

    plt.title('ROC Grid with Precision Contours')
    plt.tight_layout()
    plt.show()

draw_plot()
6.4 Rule list 3
import numpy as np
import matplotlib.pyplot as plt

c = 1
pos = c * 50
neg = 50

def rocgrid(pos, neg):
    fig, ax = plt.subplots(figsize=(6, 6))
    ax.set_xlim(0, neg)
    ax.set_ylim(0, pos)
    ax.set_xticks([])
    ax.set_yticks([])
    ax.set_xlabel("Negatives")
    ax.set_ylabel("Positives")
    ax.set_aspect('auto')
    ax.grid(which='both', linestyle='--', linewidth=0.5, color='gray', alpha=0.5)
    return ax

def metric(tp, fp, Pos, Neg, m):
    if tp + fp == 0:
        return 0
    N = Pos + Neg
    TP = tp
    FP = fp
    FN = Pos - TP
    TN = Neg - FP
    if m == 'accuracy': return (TP + TN) / N
    if m == 'wracc': return TP / N - (TP + FP) * (TP + FN) / N ** 2
    if m == 'confirmation':
        num = ((TP + FP) * (FP + TN)) / N ** 2 - FP / N
        den = np.sqrt((TP + FP) * (FP + TN)) / N - ((TP + FP) * (FP + TN)) / N ** 2
        return num / den if den != 0 else 0
    if m == 'generality': return (TP + FP) / N
    if m == 'precision': return TP / (TP + FP)
    if m == 'laplace-precision': return (TP + 10) / (TP + FP + 20)
    if m == 'f-measure': return 2 * TP / (2 * TP + FP + FN)
    if m == 'g-measure': return TP / (FP + Pos)
    if m == 'precision*recall': return TP ** 2 / ((TP + FP) * (TP + FN))
    if m == 'avg-precision-recall': return TP / (2 * (TP + FP)) + TP / (2 * (TP + FN))
    if m == 'aucsplit': return (TP * Neg + Pos * TN) / (2 * Pos * Neg)
    if m == 'balanced-aucsplit': return TP / Pos - FP / Neg
    if m == 'chi2': return (TP * TN - FP * FN) ** 2 / ((TP + FP) * (TP + FN) * (FP + TN) * (FN + TN))
    if m == 'info-gain': return entropy(Pos, Neg) - (TP + FP) / N * entropy(TP, FP) - (FN + TN) / N * entropy(FN, TN)
    if m == 'gini': return gini(Pos, Neg) - (TP + FP) / N * gini(TP, FP) - (FN + TN) / N * gini(FN, TN)
    if m == 'dkm': return dkm(Pos, Neg) - (TP + FP) / N * dkm(TP, FP) - (FN + TN) / N * dkm(FN, TN)
    if m == 'entropy': return entropy(TP, FP) / 2
    if m == 'giniimp': return gini(TP, FP)
    if m == 'dkmimp': return dkm(TP, FP)
    if m == 'minacc': return minacc(TP, FP)

def entropy(P, N):
    if P == 0 or N == 0:
        return 0
    p = P / (P + N)
    n = N / (P + N)
    return -p * np.log2(p) - n * np.log2(n)

def gini(P, N):
    p = P / (P + N)
    n = N / (P + N)
    return 4 * p * n

def dkm(P, N):
    p = P / (P + N)
    n = N / (P + N)
    return 2 * np.sqrt(p * n)

def minacc(P, N):
    p = P / (P + N)
    n = N / (P + N)
    return min(p, n)

def contour1(ax, m, col, lty, tp, fp, Pos, Neg):
    v = metric(tp, fp, Pos, Neg, m)
    r = min(2 - 2 * v, 1)
    color = (r, v, 0)
    ax.plot(fp, tp, marker='o', color=color, markersize=8)
    if tp == 0 or fp == 0:
        ax.plot([0, fp], [0, tp], linestyle=lty, color=color, linewidth=2)
        return
    Pos = tp
    Neg = fp
    x = np.arange(0, Neg + 1)
    y = np.arange(0, Pos + 1)
    z = np.zeros((len(y), len(x)))
    for i in range(len(x)):
        for j in range(len(y)):
            z[j, i] = metric(y[j], x[i], Pos, Neg, m)
    cs = ax.contour(x, y, z, levels=[v], colors=[color], linestyles=[lty])

pos = 20
neg = 10
d = 1
method = 'precision'
colour = 'black'
p = 0
n = 10

ax = rocgrid(pos, neg)
ax.arrow(neg - d, pos - d, n - neg + d, p - pos + d,
         head_width=0.8, head_length=1.5, fc='violet', ec='violet', linewidth=2)

contour1(ax, method, 'red', 'solid', p, n, pos, neg)
contour1(ax, method, 'green', 'solid', 10, 0, pos, neg)
contour1(ax, method, colour, 'dotted', 20, 10, pos, neg)

plt.title('ROC Grid - Métrica: ' + method)
plt.tight_layout()
plt.show()
6.5 Rulelist Tree
import matplotlib.pyplot as plt

x = [0, 400, 400, 500, 500]
y = [0,   0, 300, 300, 500]

h = 500
w = 500
grid_step = 100

plt.figure(figsize=(6, 6))
plt.xlim(0, w)
plt.ylim(0, h)
plt.xlabel("Negatives")
plt.ylabel("Positives")
plt.xticks([])
plt.yticks([])
plt.gca().set_aspect('equal')

for gx in range(grid_step, w + 1, grid_step):
    plt.axvline(x=gx, color="gray", linestyle="dotted")
for gy in range(grid_step, h + 1, grid_step):
    plt.axhline(y=gy, color="gray", linestyle="dotted")

def plotsplit(l, r, m, labels, oo, pp, qq):
    plt.plot([x[l - 1], x[r - 1]], [y[l - 1], y[r - 1]], linestyle="dashed", color="black")
    plt.text((x[l - 1] + x[r - 1]) / 2 + oo[0], (y[l - 1] + y[r - 1]) / 2 + oo[1], labels[0])
    plt.text((x[l - 1] + x[m - 1]) / 2 + pp[0], (y[l - 1] + y[m - 1]) / 2 + pp[1], labels[1])
    plt.text((x[m - 1] + x[r - 1]) / 2 + qq[0], (y[m - 1] + y[r - 1]) / 2 + qq[1], labels[2])
    plt.arrow((x[l - 1] + x[r - 1]) / 2, (y[l - 1] + y[r - 1]) / 2,
              x[m - 1] - (x[l - 1] + x[r - 1]) / 2 + oo[0],
              y[m - 1] - (y[l - 1] + y[r - 1]) / 2 + pp[1],
              head_width=10, head_length=15, fc='black', ec='black', length_includes_head=True)

plotsplit(1, 5, 2, ["A", "B", "C"], [-10, 10], [0, 10], [10, -10])
plotsplit(2, 5, 3, ["", "D", "E"], [10, -10], [-10, -10], [-10, 10])
plotsplit(3, 5, 4, ["", "F", "G"], [-10, -10], [0, 10], [-10, -40])

plt.plot(x[0:2], y[0:2], linewidth=5, color='red')
plt.plot(x[1:3], y[1:3], linewidth=3, color='green')
plt.plot(x[2:4], y[2:4], linewidth=3, color='red')
plt.plot(x[3:5], y[3:5], linewidth=5, color='green')
plt.scatter(x, y, color='black', zorder=5)

plt.plot([0, 0, 0, 100, 500], [0, 300, 500, 500, 500], linewidth=5, color='blue')

plt.text(15, 150, "D", color="blue")
plt.text(15, 400, "G", color="blue")
plt.text(50, 485, "F", color="blue")
plt.text(300, 485, "B", color="blue")

plt.show()
6.6 ABBA
import matplotlib.pyplot as plt

h = 500
w = 500
grid_step = 100

fig, ax = plt.subplots()
ax.set_xlim(0, w)
ax.set_ylim(0, h)
ax.set_xlabel("Negatives")
ax.set_ylabel("Positives")

gx = grid_step
while gx <= w:
    ax.axvline(gx, color="gray", linestyle="dotted")
    gx += grid_step

gy = grid_step
while gy <= h:
    ax.axhline(gy, color="gray", linestyle="dotted")
    gy += grid_step

x = [0, 100, 300, 500]
y = [0, 400, 500, 500]
col = "red"
ax.plot(x, y, linewidth=5, marker='o', color=col)

ax.text((x[0] + x[1])/2 + 20, (y[0] + y[1])/2, "-B", color=col)
ax.text((x[1] + x[2])/2 + 70, (y[1] + y[2])/2 + 20, "AB", color=col)
ax.text((x[2] + x[3])/2, (y[2] + y[3])/2 - 20, "--, A-", color=col)

a = [0, 100, 400, 500]
b = [0, 400, 500, 500]
col = "blue"
ax.plot(a, b, linewidth=3, marker='o', color=col)

ax.text((a[0] + a[1])/2 + 20, (b[0] + b[1])/2 - 20, "B", color=col)
ax.text((a[1] + a[2])/2, (b[1] + b[2])/2 - 20, "A", color=col)
ax.text((a[2] + a[3])/2, (b[2] + b[3])/2 - 20, "-", color=col)

plt.show()
import matplotlib.pyplot as plt

h = 500
w = 500
grid_step = 100

fig, ax = plt.subplots()
ax.set_xlim(0, w)
ax.set_ylim(0, h)
ax.set_xlabel("Negatives")
ax.set_ylabel("Positives")

gx = grid_step
while gx <= w:
    ax.axvline(gx, color="gray", linestyle="dotted")
    gx += grid_step

gy = grid_step
while gy <= h:
    ax.axhline(gy, color="gray", linestyle="dotted")
    gy += grid_step

a = [0, 100, 400, 500]
b = [0, 400, 500, 500]
col = "blue"
ax.plot(a, b, linewidth=3, marker='o', color=col)

ax.text((a[1] + a[2])/2 + 20, (b[1] + b[2])/2, "B\\A", color=col)
ax.text((a[2] + a[3])/2 - 20, (b[2] + b[3])/2 - 30, "A", color=col)
ax.text((a[3] + 500)/2 + 20, (b[3] + 500)/2 - 20, "-", color=col)

a = [0, 300, 500]
b = [0, 500, 500]
col = "violet"
ax.plot(a, b, linewidth=3, marker='o', color=col)

ax.text((a[1] + a[2])/2 + 20, (b[1] + b[2])/2, "B", color=col)
ax.text((a[2] + 500)/2 + 20, (b[2] + 500)/2 - 20, "A\\B, -", color=col)

x = [0, 100, 300, 500]
y = [0, 400, 500, 500]
col = "red"
ax.plot(x[1:3], y[1:3], linestyle="dotted", color=col)
ax.text((x[1] + x[2])/2 - 15, (y[1] + y[2])/2 + 15, "", color=col)

plt.show()
6.7 Rules 1
import numpy as np
import matplotlib.pyplot as plt

c = 1
pos = c * 50
neg = 50

def entropy(P, N):
    if P == 0 or N == 0:
        return 0
    p = P / (P + N)
    n = N / (P + N)
    return -p * np.log2(p) - n * np.log2(n)

def gini(P, N):
    p = P / (P + N)
    n = N / (P + N)
    return 4 * p * n

def dkm(P, N):
    p = P / (P + N)
    n = N / (P + N)
    return 2 * np.sqrt(p * n)

def minacc(P, N):
    p = P / (P + N)
    n = N / (P + N)
    return min(p, n)

def metric(tp, fp, m):
    if tp + fp == 0:
        return 0
    Pos = pos
    Neg = neg
    N = Pos + Neg
    TP = tp
    FP = fp
    FN = Pos - TP
    TN = Neg - FP
    if m == 'accuracy': return (TP + TN) / N
    if m == 'wracc': return TP / N - (TP + FP) * (TP + FN) / N ** 2
    if m == 'confirmation':
        num = ((TP + FP) * (FP + TN)) / N ** 2 - FP / N
        den = np.sqrt((TP + FP) * (FP + TN)) / N - ((TP + FP) * (FP + TN)) / N ** 2
        return num / den if den != 0 else 0
    if m == 'generality': return (TP + FP) / N
    if m == 'precision': return TP / (TP + FP)
    if m == 'laplace-precision': return (TP + 10) / (TP + FP + 20)
    if m == 'f-measure': return 2 * TP / (2 * TP + FP + FN)
    if m == 'g-measure': return TP / (FP + Pos)
    if m == 'precision*recall': return TP ** 2 / ((TP + FP) * (TP + FN))
    if m == 'avg-precision-recall': return TP / (2 * (TP + FP)) + TP / (2 * (TP + FN))
    if m == 'aucsplit': return (TP * Neg + Pos * TN) / (2 * Pos * Neg)
    if m == 'balanced-aucsplit': return TP / Pos - FP / Neg
    if m == 'chi2': return (TP * TN - FP * FN) ** 2 / ((TP + FP) * (TP + FN) * (FP + TN) * (FN + TN))
    if m == 'info-gain': return entropy(Pos, Neg) - (TP + FP) / N * entropy(TP, FP) - (FN + TN) / N * entropy(FN, TN)
    if m == 'gini': return gini(Pos, Neg) - (TP + FP) / N * gini(TP, FP) - (FN + TN) / N * gini(FN, TN)
    if m == 'dkm': return dkm(Pos, Neg) - (TP + FP) / N * dkm(TP, FP) - (FN + TN) / N * dkm(FN, TN)
    if m == 'entropy': return entropy(TP, FP) / 2
    if m == 'giniimp': return gini(TP, FP)
    if m == 'dkmimp': return dkm(TP, FP)
    if m == 'minacc': return minacc(TP, FP)

def rocgrid():
    fig, ax = plt.subplots(figsize=(6, 6))
    ax.set_xlim(0, neg)
    ax.set_ylim(0, pos)
    ax.set_xticks([])
    ax.set_yticks([])
    ax.set_xlabel("Negatives")
    ax.set_ylabel("Positives")
    ax.grid(which='both', linestyle='--', linewidth=0.5, color='gray', alpha=0.5)
    return ax

def contour1(ax, m, col, lty, tp, fp):
    v = metric(tp, fp, m)
    r = min(2 - 2 * v, 1)
    color = (r, v, 0)
    ax.plot(fp, tp, marker='o', color=color, markersize=8)
    if tp == 0 or fp == 0:
        ax.plot([0, fp], [0, tp], linestyle=lty, color=color, linewidth=2)
        return
    x = np.arange(0, fp + 1)
    y = np.arange(0, tp + 1)
    z = np.zeros((len(y), len(x)))
    for i in range(len(x)):
        for j in range(len(y)):
            z[j, i] = metric(y[j], x[i], m)
    cs = ax.contour(x, y, z, levels=[v], colors=[color], linestyles=[lty])

save = FalseListethod, 'green', 'solid', p, n)
contour1(ax, method, colour, 'dotted', 10, 30)
contour1(ax, method, colour, 'dotted', 20, 20)
contour1(ax, method, colour, 'dotted', 0, 40)
contour1(ax, method, colour, 'dotted', 50, 10)
contour1(ax, method, colour, 'dotted', 50, 30)
contour1(ax, method, colour, 'dotted', 0, 20)
contour1(ax, method, colour, 'dotted', 30, 40)
contour1(ax, method, colour, 'dotted', 20, 10)

plt.title('ROC Grid - Métrica: ' + method)
plt.tight_layout()
plt.show()
6.8 Rules 2
import numpy as np
import matplotlib.pyplot as plt

def entropy(P, N):
    if P == 0 or N == 0:
        return 0
    p = P / (P + N)
    n = N / (P + N)
    return -p * np.log2(p) - n * np.log2(n)

def gini(P, N):
    if P + N == 0:
        return 0
    p = P / (P + N)
    n = N / (P + N)
    return 4 * p * n

def dkm(P, N):
    if P + N == 0:
        return 0
    p = P / (P + N)
    n = N / (P + N)
    return 2 * np.sqrt(p * n)

def minacc(P, N):
    if P + N == 0:
        return 0
    p = P / (P + N)
    n = N / (P + N)
    return min(p, n)

def metric(tp, fp, Pos, Neg, m):
    N = Pos + Neg
    TP = tp
    FP = fp
    FN = Pos - TP
    TN = Neg - FP

    if TP + FP == 0:
        return 0

    if m == 'accuracy':
        return (TP + TN) / N
    if m == 'wracc':
        return TP / N - (TP + FP) * (TP + FN) / N**2
    if m == 'generality':
        return (TP + FP) / N
    if m == 'precision':
        return TP / (TP + FP)
    if m == 'laplace-precision':
        return (TP + 10) / (TP + FP + 20)
    if m == 'f-measure':
        return 2 * TP / (2 * TP + FP + FN)
    if m == 'g-measure':
        return TP / (FP + Pos)
    if m == 'precision*recall':
        return TP**2 / ((TP + FP) * (TP + FN))
    if m == 'avg-precision-recall':
        return TP / (2 * (TP + FP)) + TP / (2 * (TP + FN))
    if m == 'balanced-aucsplit':
        return TP / Pos - FP / Neg
    if m == 'entropy':
        return entropy(TP, FP) / 2
    if m == 'giniimp':
        return gini(TP, FP)
    if m == 'dkmimp':
        return dkm(TP, FP)
    if m == 'minacc':
        return minacc(TP, FP)
    return 0

def contour1(ax, m, tp, fp, Pos, Neg, color, lty):
    v = metric(tp, fp, Pos, Neg, m)
    x = np.arange(0, Neg + 1)
    y = np.arange(0, Pos + 1)
    z = np.zeros((len(y), len(x)))

    for i in range(len(x)):
        for j in range(len(y)):
            z[j, i] = metric(j, i, Pos, Neg, m)

    ax.contour(x, y, z, levels=[v], colors=color, linestyles=lty, linewidths=2)
    ax.plot(fp, tp, 'o', color=color, markersize=5)

def rocgrid(pos, neg):
    fig, ax = plt.subplots(figsize=(8, 6))
    ax.set_xlim(0, neg)
    ax.set_ylim(0, pos)
    ax.set_xlabel("Negatives")
    ax.set_ylabel("Positives")
    ax.set_xticks(np.arange(0, neg + 1, 10))
    ax.set_yticks(np.arange(0, pos + 1, 10))
    ax.grid(True, which='both', linestyle='--', linewidth=0.5)
    return fig, ax

pos = 30
neg = 50
method = 'precision'

fig, ax = rocgrid(pos, neg)

ax.plot([0, neg, neg, 0, 0], [0, 0, pos, pos, 0], color='black', linewidth=2)

p = 30
n = 10
ax.arrow(neg - 1, pos - 1, n - neg + 2, p - pos - 2, head_width=1, head_length=1, fc='violet', ec='violet', linewidth=2)

contour1(ax, method, p, n, pos, neg, 'orange', 'solid')

test_points = [(10, 30), (20, 20), (0, 40), (30, 30), (0, 20), (20, 40), (10, 10), (0, 0)]
for tp, fp in test_points:
    contour1(ax, method, tp, fp, pos, neg, 'black', 'dotted')

p1 = 20
n1 = 0
ax.plot([0, n, n, 0, 0], [0, 0, p, p, 0], color='blue', linewidth=2)
ax.arrow(n - 1, p - 1, n1 - n + 2, p1 - p + 2, head_width=1, head_length=1, fc='violet', ec='violet', linewidth=2)

contour1(ax, method, p1, n1, p, n, 'green', 'solid')
for tp, fp in [(10, 10), (30, 10), (0, 0)]:
    contour1(ax, method, tp, fp, p, n, 'blue', 'dotted')

plt.tight_layout()
plt.show()
/home/ck22122/anaconda3/envs/clmr/lib/python3.7/site-packages/ipykernel_launcher.py:82: UserWarning: No contour levels were found within the data range.
6.9 Rules 3
import numpy as np
import matplotlib.pyplot as plt

def entropy(P, N):
    if P == 0 or N == 0:
        return 0
    p = P / (P + N)
    n = N / (P + N)
    return -p * np.log2(p) - n * np.log2(n)

def gini(P, N):
    p = P / (P + N)
    n = N / (P + N)
    return 4 * p * n

def dkm(P, N):
    p = P / (P + N)
    n = N / (P + N)
    return 2 * np.sqrt(p * n)

def minacc(P, N):
    p = P / (P + N)
    n = N / (P + N)
    return min(p, n)

def metric(tp, fp, Pos, Neg, m):
    if tp + fp == 0:
        return 0
    N = Pos + Neg
    TP = tp
    FP = fp
    FN = Pos - TP
    TN = Neg - FP
    if m == 'accuracy':
        return (TP + TN) / N
    if m == 'wracc':
        return TP / N - (TP + FP) * (TP + FN) / N**2
    if m == 'confirmation':
        num = (TP + FP) * (FP + TN) / N**2 - FP / N
        den = np.sqrt((TP + FP) * (FP + TN) / N**2) - (TP + FP) * (FP + TN) / N**2
        return num / den if den != 0 else 0
    if m == 'generality':
        return (TP + FP) / N
    if m == 'precision':
        return TP / (TP + FP)
    if m == 'laplace-precision':
        return (TP + 10) / (TP + FP + 20)
    if m == 'f-measure':
        return 2 * TP / (2 * TP + FP + FN)
    if m == 'g-measure':
        return TP / (FP + Pos)
    if m == 'precision*recall':
        return TP**2 / ((TP + FP) * (TP + FN))
    if m == 'avg-precision-recall':
        return TP / (2 * (TP + FP)) + TP / (2 * (TP + FN))
    if m == 'aucsplit':
        return (TP * Neg + Pos * TN) / (2 * Pos * Neg)
    if m == 'balanced-aucsplit':
        return TP / Pos - FP / Neg
    if m == 'chi2':
        return ((TP * TN - FP * FN)**2) / ((TP + FP) * (TP + FN) * (FP + TN) * (FN + TN))
    if m == 'info-gain':
        return entropy(Pos, Neg) - (TP + FP) / N * entropy(TP, FP) - (FN + TN) / N * entropy(FN, TN)
    if m == 'gini':
        return gini(Pos, Neg) - (TP + FP) / N * gini(TP, FP) - (FN + TN) / N * gini(FN, TN)
    if m == 'dkm':
        return dkm(Pos, Neg) - (TP + FP) / N * dkm(TP, FP) - (FN + TN) / N * dkm(FN, TN)
    if m == 'entropy':
        return entropy(TP, FP) / 2
    if m == 'giniimp':
        return gini(TP, FP)
    if m == 'dkmimp':
        return dkm(TP, FP)
    if m == 'minacc':
        return minacc(TP, FP)
    return 0

def rocgrid(pos, neg):
    plt.plot([0, neg], [0, pos], color='white')
    plt.xlim(0, neg)
    plt.ylim(0, pos)
    plt.gca().set_aspect('auto', adjustable='box')
    plt.xlabel("Negatives")
    plt.ylabel("Positives")
    plt.grid(True, which='both', linestyle='--', linewidth=0.5)

def box(x0, y0, x1, y1, col):
    plt.plot([x0, x0, x1, x1, x0], [y0, y1, y1, y0, y0], color=col, linewidth=2)

def contour1(m, col, lty, tp, fp, Pos, Neg):
    v = metric(tp, fp, Pos, Neg, m)
    col = (min(2 - 2 * v, 1), v, 0)
    plt.plot(fp, tp, 'o', color=col, linewidth=3)
    if tp == 0 or fp == 0:
        plt.plot([0, fp], [0, tp], color=col, linestyle=lty, linewidth=4)
        return
    Pos = tp
    Neg = fp
    x = np.arange(0, Neg + 1)
    y = np.arange(0, Pos + 1)
    z = np.zeros((len(y), len(x)))
    for i in range(len(x)):
        for j in range(len(y)):
            z[j, i] = metric(y[j], x[i], Pos, Neg, m)
    CS = plt.contour(x, y, z, levels=[v], colors=[col], linestyles=lty, linewidths=2)
    plt.clabel(CS, inline=1, fontsize=8, fmt='')

pos = 10
neg = 50
rocgrid(pos, neg)
d = 0.5
method = 'precision'
colour = 'black'
box(0, 0, neg, pos, colour)
p = 10
n = 10
plt.arrow(neg - d, pos - d, n - (neg - d), p - (pos - d), color='violet', head_width=1.0, linewidth=3)
contour1(method, 'orange', 'solid', p, n, pos, neg)
contour1(method, colour, 'dotted', 10, 30, pos, neg)
contour1(method, colour, 'dotted', 0, 40, pos, neg)
contour1(method, colour, 'dotted', 0, 20, pos, neg)
contour1(method, colour, 'dotted', 10, 40, pos, neg)
contour1(method, colour, 'dotted', 0, 10, pos, neg)
colour = 'blue'
box(0, 0, n, p, colour)
p1 = 10
n1 = 0
plt.arrow(n - d, p - d, n1 - (n - d), p1 - (p - d), color='violet', head_width=1.0, linewidth=3)
contour1(method, 'green', 'solid', p1, n1, p, n)
contour1(method, colour, 'dotted', 0, 10, p, n)
plt.show()
ABC Set
import matplotlib.pyplot as plt

h = 500
w = 500
grid_step = 100

fig, ax = plt.subplots()
ax.set_xlim(0, w)
ax.set_ylim(0, h)
ax.set_xlabel("Negatives")
ax.set_ylabel("Positives")

gx = grid_step
while gx <= w:
    ax.axvline(gx, color="gray", linestyle="dotted")
    gx += grid_step

gy = grid_step
while gy <= h:
    ax.axhline(gy, color="gray", linestyle="dotted")
    gy += grid_step

a = [0, 100, 400, 500, 500]
b = [0, 400, 500, 500, 500]
col = "blue"
ax.plot(a, b, linewidth=3, marker='o', color=col)

ax.text((a[0]+a[1])/2 + 20, (b[0]+b[1])/2, "B\\A", color=col)
ax.text((a[1]+a[2])/2, (b[1]+b[2])/2 - 20, "A", color=col)
ax.text((a[2]+a[3])/2, (b[2]+b[3])/2 - 30, "C\\B\\A", color=col)

c = [0, 0, 100, 100, 400, 500, 500]
d = [0, 200, 400, 400, 500, 500, 500]
col = "orange"
ax.plot(c, d, linewidth=3, marker='o', color=col)

ax.text((c[0]+c[1])/2 + 10, (d[0]+d[1])/2, "B", color=col)
ax.text((c[1]+c[2])/2 - 10, (d[1]+d[2])/2 + 10, "BC", color=col)
ax.text((c[3]+c[4])/2 - 10, (d[2]+d[4])/2 + 15, "AB, C", color=col)
ax.text((c[5]+c[6])/2, (d[5]+d[6])/2 - 10, "A", color=col)

plt.show()
ABC
import matplotlib.pyplot as plt

h = 500
w = 500
grid_step = 100

plt.figure(figsize=(6, 6))
plt.xlim(0, w)
plt.ylim(0, h)
plt.xlabel("Negatives")
plt.ylabel("Positives")
plt.xticks([])
plt.yticks([])
plt.gca().set_aspect('auto')

gx = grid_step
while gx <= w:
    plt.axvline(x=gx, color='gray', linestyle='dotted')
    gx += grid_step

gy = grid_step
while gy <= h:
    plt.axhline(y=gy, color='gray', linestyle='dotted')
    gy += grid_step

x = [0, 0, 100, 300, 500]
y = [0, 200, 400, 500, 500]
col = "red"
plt.plot(x, y, linewidth=3, marker='o', color=col)

plt.text((x[0]+x[1])/2+20, (y[0]+y[1])/2+40, "-B-", color=col)
plt.text((x[1]+x[2])/2-20, (y[1]+y[2])/2+20, "-BC", color=col)
plt.text((x[2]+x[3])/2-20, (y[2]+y[3])/2+20, "AB-", color=col)
plt.text((x[3]+x[4])/2-85, (y[3]+y[4])/2-15, "A--, --C", color=col)

a = [0, 100, 400, 500, 500]
b = [0, 400, 500, 500, 500]
col = "blue"
plt.plot(a, b, linewidth=3, marker='o', color=col)

plt.text((a[0]+a[1])/2+20, (b[0]+b[1])/2-20, "B\\A", color=col)
plt.text((a[1]+a[2])/2+20, (b[1]+b[2])/2-20, "A", color=col)
plt.text((a[2]+a[3])/2+0, (b[2]+b[3])/2-20, "C\\B\\A", color=col)

plt.show()
ABC Tree
Items CC Dolphins
Items CC
Items Dolphins
Items
Rules 1a
import numpy as np
import matplotlib.pyplot as plt

c = 1
pos = c * 50
neg = 50

def rocgrid():
    plt.plot([0, neg], [0, pos], alpha=0)
    plt.xlim(0, neg)
    plt.ylim(0, pos)
    plt.xticks([])
    plt.yticks([])
    plt.xlabel("Negatives")
    plt.ylabel("Positives")
    plt.grid(True, which='both', linewidth=0.5, color='gray', linestyle='-')
    plt.gca().set_aspect('auto')

def box(x0, y0, x1, y1, col):
    plt.plot([x0, x0, x1, x1, x0], [y0, y1, y1, y0, y0], color=col, linestyle='-', linewidth=2)

def entropy(P, N):
    if P == 0 or N == 0:
        return 0
    p = P / (P + N)
    n = N / (P + N)
    return -p * np.log2(p) - n * np.log2(n)

def gini(P, N):
    p = P / (P + N)
    n = N / (P + N)
    return 4 * p * n

def dkm(P, N):
    p = P / (P + N)
    n = N / (P + N)
    return 2 * np.sqrt(p * n)

def minacc(P, N):
    p = P / (P + N)
    n = N / (P + N)
    return min(p, n)

def metric(tp, fp, Pos, Neg, m):
    if tp + fp == 0:
        return 0
    N = Pos + Neg
    TP = tp
    FP = fp
    FN = Pos - TP
    TN = Neg - FP
    if m == 'accuracy': return (TP + TN) / N
    if m == 'wracc': return TP / N - (TP + FP) * (TP + FN) / N**2
    if m == 'confirmation':
        a = ((TP + FP) * (FP + TN)) / N**2
        b = FP / N
        den = np.sqrt((TP + FP) * (FP + TN)) / N
        return (a - b) / (den - a) if den != a else 0
    if m == 'generality': return (TP + FP) / N
    if m == 'precision': return TP / (TP + FP)
    if m == 'laplace-precision': return (TP + 10) / (TP + FP + 20)
    if m == 'f-measure': return 2 * TP / (2 * TP + FP + FN)
    if m == 'g-measure': return TP / (FP + Pos)
    if m == 'precision*recall': return TP**2 / ((TP + FP) * (TP + FN))
    if m == 'avg-precision-recall': return TP / (2 * (TP + FP)) + TP / (2 * (TP + FN))
    if m == 'aucsplit': return (TP * Neg + Pos * TN) / (2 * Pos * Neg)
    if m == 'balanced-aucsplit': return TP / Pos - FP / Neg
    if m == 'chi2':
        denom = (TP + FP) * (TP + FN) * (FP + TN) * (FN + TN)
        return (TP * TN - FP * FN)**2 / denom if denom != 0 else 0
    if m == 'info-gain': return entropy(Pos, Neg) - (TP + FP) / N * entropy(TP, FP) - (FN + TN) / N * entropy(FN, TN)
    if m == 'gini': return gini(Pos, Neg) - (TP + FP) / N * gini(TP, FP) - (FN + TN) / N * gini(FN, TN)
    if m == 'dkm': return dkm(Pos, Neg) - (TP + FP) / N * dkm(TP, FP) - (FN + TN) / N * dkm(FN, TN)
    if m == 'entropy': return entropy(TP, FP) / 2
    if m == 'giniimp': return gini(TP, FP)
    if m == 'dkmimp': return dkm(TP, FP)
    if m == 'minacc': return minacc(TP, FP)

def contour1(m, col, lty, tp, fp, Pos, Neg):
    v = metric(tp, fp, Pos, Neg, m)
    c = (min(2 - 2 * v, 1), v, 0)
    plt.plot(fp, tp, 'o', color=c, linewidth=3)
    if tp == 0 or fp == 0:
        return
    Pos = tp
    Neg = fp
    x = np.arange(0, Neg + 1)
    y = np.arange(0, Pos + 1)
    z = np.zeros((len(y), len(x)))
    for i, xi in enumerate(x):
        for j, yj in enumerate(y):
            z[j, i] = metric(yj, xi, Pos, Neg, m)
    v = metric(tp, fp, Pos, Neg, m)
    CS = plt.contour(x, y, z, levels=[v], colors=[col], linestyles=[lty], linewidths=2)
    for c in CS.collections:
        c.set_label("")

rocgrid()
d = 1
method = 'laplace-precision'
colour = 'black'
box(0, 0, neg, pos, colour)
p = 50
n = 10
plt.arrow(neg - d, pos - d, -(neg - n), -(pos - p), color='violet', head_width=1, linewidth=3, length_includes_head=True)
contour1(method, 'orange', 'solid', p, n, pos, neg)
contour1(method, 'orange', 'solid', 20, 0, pos, neg)
contour1(method, colour, 'dotted', 10, 30, pos, neg)
contour1(method, colour, 'dotted', 20, 20, pos, neg)
contour1(method, colour, 'dotted', 0, 40, pos, neg)
contour1(method, colour, 'dotted', 50, 30, pos, neg)
contour1(method, colour, 'dotted', 0, 20, pos, neg)
contour1(method, colour, 'dotted', 30, 40, pos, neg)
contour1(method, colour, 'dotted', 20, 10, pos, neg)
colour = 'blue'
box(0, 0, n, p, colour)
p1 = 30
n1 = 0
plt.arrow(n - d, p - d, -(n - n1), p1 - p, color='violet', head_width=1, linewidth=3, length_includes_head=True)
contour1(method, 'green', 'solid', p1, n1, p, n)
contour1(method, colour, 'dotted', 20, 0, p, n)
contour1(method, colour, 'dotted', 10, 10, p, n)
contour1(method, colour, 'dotted', 20, 10, p, n)
plt.show()
Subgroups
import numpy as np
import matplotlib.pyplot as plt
from math import log2, sqrt

c = 1
pos = c * 50
neg = 50

def entropy(P, N):
    if P == 0 or N == 0:
        return 0
    p = P / (P + N)
    n = N / (P + N)
    return -p * log2(p) - n * log2(n)

def gini(P, N):
    p = P / (P + N)
    n = N / (P + N)
    return 4 * p * n

def dkm(P, N):
    p = P / (P + N)
    n = N / (P + N)
    return 2 * sqrt(p * n)

def metric(tp, fp, m):
    Pos = pos
    Neg = neg
    N = Pos + Neg
    TP = tp
    FP = fp
    FN = Pos - TP
    TN = Neg - FP

    if tp + fp == 0:
        return 0

    if m == 'accuracy':
        return (TP + TN) / N
    elif m == 'wracc':
        return TP / N - (TP + FP) * (TP + FN) / (N ** 2)
    elif m == 'precision':
        return TP / (TP + FP)
    elif m == 'f-measure':
        return 2 * TP / (2 * TP + FP + FN)
    elif m == 'gini':
        return gini(Pos, Neg) - ((TP + FP) / N) * gini(TP, FP) - ((FN + TN) / N) * gini(FN, TN)
    elif m == 'entropy':
        return ((TP + FP) / N) * entropy(TP, FP)
    elif m == 'dkm':
        return dkm(Pos, Neg) - ((TP + FP) / N) * dkm(TP, FP) - ((FN + TN) / N) * dkm(FN, TN)
    else:
        return 0

def rocgrid():
    fig, ax = plt.subplots(figsize=(6, 6))
    ax.set_xlim(0, neg)
    ax.set_ylim(0, pos)
    ax.set_xlabel('Negatives')
    ax.set_ylabel('Positives')
    ax.set_xticks(np.arange(0, neg+1, 10))
    ax.set_yticks(np.arange(0, pos+1, 10))
    ax.grid(True, color='gray', linestyle='--', linewidth=0.5)
    return ax

def contour1(ax, m, color, linestyle, tp, fp):
    x = np.arange(0, neg+1)
    y = np.arange(0, pos+1)
    Z = np.zeros((len(y), len(x)))

    for i, xi in enumerate(x):
        for j, yj in enumerate(y):
            Z[j, i] = metric(yj, xi, m)

    v = metric(tp, fp, m)
    CS = ax.contour(x, y, Z, levels=[v], colors=color, linestyles=linestyle)
    ax.plot(fp, tp, 'o', color=color)

ax = rocgrid()
method = 'wracc'
d = 1

contour1(ax, method, 'red', 'solid',   0, 40)
contour1(ax, method, 'black', 'dotted', 10, 30)
contour1(ax, method, 'black', 'dotted', 20, 20)
contour1(ax, method, 'black', 'dotted', 20, 0)
contour1(ax, method, 'orange', 'solid', 50, 10)
contour1(ax, method, 'black', 'dotted', 50, 30)
contour1(ax, method, 'black', 'dotted', 0, 20)
contour1(ax, method, 'black', 'dotted', 30, 40)
contour1(ax, method, 'black', 'dotted', 20, 10)

plt.title("")
plt.show()
Subgroups
import numpy as np
import matplotlib.pyplot as plt
from math import log2, sqrt

c = 1
pos = c * 50
neg = 50

def entropy(P, N):
    if P == 0 or N == 0:
        return 0
    p = P / (P + N)
    n = N / (P + N)
    return -p * log2(p) - n * log2(n)

def gini(P, N):
    p = P / (P + N)
    n = N / (P + N)
    return 4 * p * n

def dkm(P, N):
    p = P / (P + N)
    n = N / (P + N)
    return 2 * sqrt(p * n)

def minacc(P, N):
    p = P / (P + N)
    n = N / (P + N)
    return min(p, n)

def metric(tp, fp, m):
    if tp + fp == 0:
        return 0
    Pos = pos
    Neg = neg
    N = Pos + Neg
    TP = tp
    FP = fp
    FN = Pos - TP
    TN = Neg - FP
    if m == 'accuracy': return (TP + TN) / N
    if m == 'wracc': return TP / N - (TP + FP) * (TP + FN) / (N ** 2)
    if m == 'confirmation':
        A = (TP + FP) * (FP + TN) / (N ** 2)
        B = FP / N
        C = sqrt(A)
        return (A - B) / (C - A) if C != A else 0
    if m == 'generality': return (TP + FP) / N
    if m == 'precision': return TP / (TP + FP)
    if m == 'laplace-precision': return (TP + 10) / (TP + FP + 20)
    if m == 'f-measure': return 2 * TP / (2 * TP + FP + FN)
    if m == 'g-measure': return TP / (FP + Pos)
    if m == 'precision*recall': return TP ** 2 / ((TP + FP) * (TP + FN))
    if m == 'avg-precision-recall': return TP / (2 * (TP + FP)) + TP / (2 * (TP + FN))
    if m == 'aucsplit': return (TP * Neg + Pos * TN) / (2 * Pos * Neg)
    if m == 'balanced-aucsplit': return TP / Pos - FP / Neg
    if m == 'chi2': return ((TP * TN - FP * FN) ** 2) / ((TP + FP) * (TP + FN) * (FP + TN) * (FN + TN))
    if m == 'info-gain': return entropy(Pos, Neg) - (TP + FP) / N * entropy(TP, FP) - (FN + TN) / N * entropy(FN, TN)
    if m == 'gini': return gini(Pos, Neg) - (TP + FP) / N * gini(TP, FP) - (FN + TN) / N * gini(FN, TN)
    if m == 'dkm': return dkm(Pos, Neg) - (TP + FP) / N * dkm(TP, FP) - (FN + TN) / N * dkm(FN, TN)
    if m == 'entropy': return entropy(TP, FP) / 2
    if m == 'giniimp': return gini(TP, FP)
    if m == 'dkmimp': return dkm(TP, FP)
    if m == 'minacc': return minacc(TP, FP)
    return 0

def rocgrid():
    fig, ax = plt.subplots(figsize=(6, 6))
    ax.set_xlim(0, neg)
    ax.set_ylim(0, pos)
    ax.set_xticks(np.arange(0, neg + 1, 10))
    ax.set_yticks(np.arange(0, pos + 1, 10))
    ax.grid(True, color='gray', linestyle='--', linewidth=0.5)
    ax.set_xlabel('Negatives')
    ax.set_ylabel('Positives')
    return ax

def contour1(ax, m, color, linestyle, tp, fp):
    v = metric(tp, fp, m)
    if m == 'wracc':
        r = min(1 - 4 * v, 1)
        g = 2 * v + 0.5
        b = 0
    else:
        r = min(2 - 2 * v, 1)
        g = v
        b = 0
    plot_color = (r, g, b)
    lwd = 4 if linestyle == 'solid' else 2
    ax.plot(fp, tp, marker='o', color=plot_color, markersize=lwd)
    if tp == 0 or fp == 0:
        return
    x = np.arange(0, fp + 1)
    y = np.arange(0, tp + 1)
    Z = np.zeros((len(y), len(x)))
    for i, xi in enumerate(x):
        for j, yj in enumerate(y):
            Z[j, i] = metric(yj, xi, m)
    cs = ax.contour(x, y, Z, levels=[v], colors=[plot_color], linestyles=linestyle, linewidths=lwd - 1)

ax = rocgrid()
method = 'laplace-precision'
contour1(ax, method, 'black', 'dotted', 50, 50)
contour1(ax, method, 'black', 'dotted', 30, 40)
plt.title("laplace-precision contours")
plt.show()
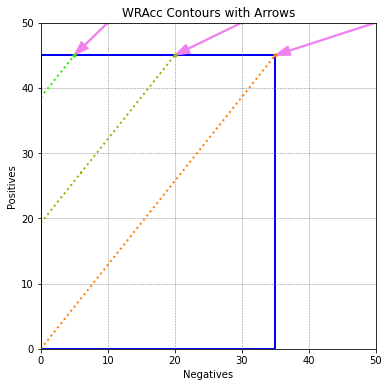
Weighted Covering
import numpy as np
import matplotlib.pyplot as plt
from math import log2

c = 1
pos = c * 50
neg = 50
Pos = pos
Neg = neg

def entropy(P, N):
    if P == 0 or N == 0:
        return 0
    p = P / (P + N)
    n = N / (P + N)
    return -p * log2(p) - n * log2(n)

def gini(P, N):
    p = P / (P + N)
    n = N / (P + N)
    return 4 * p * n

def metric(tp, fp, m):
    if tp + fp == 0:
        return 0
    N = Pos + Neg
    FN = Pos - tp
    TN = Neg - fp
    if m == 'accuracy':
        return (tp + TN) / N
    if m == 'wracc':
        return tp / N - (tp + fp) * (tp + FN) / (N ** 2)
    if m == 'precision':
        return tp / (tp + fp)
    if m == 'f-measure':
        return 2 * tp / (2 * tp + fp + FN)

def rocgrid():
    fig, ax = plt.subplots(figsize=(6, 6))
    ax.set_xlim(0, neg)
    ax.set_ylim(0, pos)
    ax.set_xticks(np.arange(0, neg + 1, 10))
    ax.set_yticks(np.arange(0, pos + 1, 10))
    ax.grid(True, color='gray', linestyle='--', linewidth=0.5)
    ax.set_xlabel('Negatives')
    ax.set_ylabel('Positives')
    return ax

def contour1(ax, m, color, linestyle, tp, fp):
    v = metric(tp, fp, m)
    if m == 'wracc':
        r = max(0, min(1 - 4 * v, 1))
        g = max(0, 2 * v + 0.5)
        b = 0
    else:
        r = min(2 - 2 * v, 1)
        g = v
        b = 0
    plot_color = (r, g, b)
    if linestyle == 0:
        ls = 'solid'
    else:
        ls = linestyle
    lwd = 4 if ls == 'solid' else 3
    if linestyle == 0:
        lwd = 1
    ax.plot(fp, tp, marker='o', color=plot_color, markersize=lwd)
    if tp == 0 or fp == 0:
        return
    x = np.arange(0, fp + 1)
    y = np.arange(0, tp + 1)
    Z = np.zeros((len(y), len(x)))
    for i, xi in enumerate(x):
        for j, yj in enumerate(y):
            Z[j, i] = metric(yj, xi, m)
    cs = ax.contour(x, y, Z, levels=[v], colors=[plot_color], linestyles=ls, linewidths=lwd - 1)


def contour2(ax, m, color, linestyle, tp, fp, tpc, fpc):
    global Pos, Neg
    Pos1, Neg1 = Pos, Neg
    Pos, Neg = 50, 50
    contour1(ax, m, color, 0, tp, fp)
    w = 0.5
    fp1 = fp - (1 - w) * fpc
    tp1 = tp - (1 - w) * tpc
    dx = 0.4 if fp == 0 else 0
    dy = 0.4 if tp == 0 else 0
    ax.arrow(fp + dx, tp + dy, fp1 - fp, tp1 - tp, color='violet', width=0.2, head_width=1.5, length_includes_head=True)
    Pos, Neg = Pos1, Neg1
    contour1(ax, m, color, linestyle, tp1, fp1)

ax = rocgrid()
method = 'wracc'
Pos, Neg = 45, 35
colour = 'blue'
ax.add_patch(plt.Rectangle((0, 0), Neg, Pos, fill=False, edgecolor=colour, linewidth=2))

contour2(ax, method, colour, 'dotted', 50, 50, 10, 30)
contour2(ax, method, colour, 'dotted', 50, 30, 10, 20)
contour2(ax, method, colour, 'dotted', 50, 10, 10, 10)

plt.title("WRAcc Contours with Arrows")
plt.show()
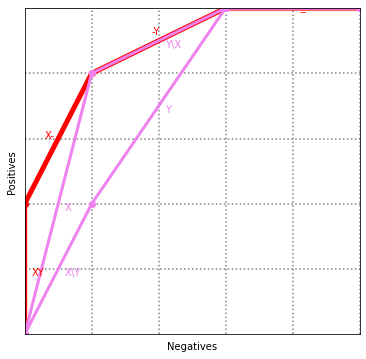
XY
import matplotlib.pyplot as plt
import numpy as np

h = 500
w = 500
grid_step = 100

fig, ax = plt.subplots(figsize=(6, 6))
ax.set_xlim(0, w)
ax.set_ylim(0, h)
ax.set_xticks([])
ax.set_yticks([])

for gx in range(grid_step, w + 1, grid_step):
    ax.axvline(x=gx, color='gray', linestyle='dotted')

for gy in range(grid_step, h + 1, grid_step):
    ax.axhline(y=gy, color='gray', linestyle='dotted')

x = [0, 0, 100, 300, 500, 500]
y = [0, 200, 400, 500, 500, 500]
ax.plot(x, y, color='red', linewidth=5, marker='o')
ax.text((x[0] + x[1]) / 2 + 10, (y[0] + y[1]) / 2 - 10, "XY", color='red')
ax.text((x[1] + x[2]) / 2 - 20, (y[1] + y[2]) / 2, "X-", color='red')
ax.text((x[2] + x[3]) / 2 - 10, (y[2] + y[3]) / 2 + 10, "-Y", color='red')
ax.text((x[3] + x[4]) / 2 + 10, (y[3] + y[4]) / 2 - 10, "--", color='red')

a = [0, 100, 300, 500, 500]
b = [0, 400, 500, 500, 500]
ax.plot(a, b, color='violet', linewidth=3, marker='o')
ax.text((a[0] + a[1]) / 2 + 10, (b[0] + b[1]) / 2 - 10, "X", color='violet')
ax.text((a[1] + a[2]) / 2 + 10, (b[1] + b[2]) / 2 - 10, "Y\\X", color='violet')

a = [0, 100, 300, 500, 500]
b = [0, 200, 500, 500, 500]
ax.plot(a, b, color='violet', linewidth=3, marker='o')
ax.text((a[0] + a[1]) / 2 + 10, (b[0] + b[1]) / 2 - 10, "X\\Y", color='violet')
ax.text((a[1] + a[2]) / 2 + 10, (b[1] + b[2]) / 2 - 10, "Y", color='violet')

ax.set_xlabel("Negatives")
ax.set_ylabel("Positives")

plt.show()