import matplotlib.pyplot as plt
import numpy as np
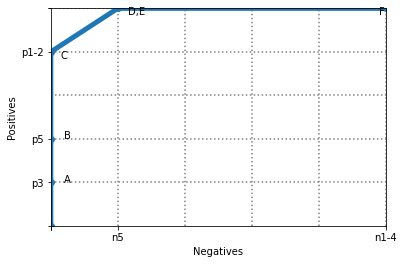
x = [0, 0, 0, 0, 100, 500]
y = [0, 100, 200, 400, 500, 500]
h = 500
w = 500
grid_step = 100
fig, ax = plt.subplots()
ax.set_xlim(0, w)
ax.set_ylim(0, h)
ax.set_xticks(x)
ax.set_xticklabels(['', '', '', '', 'n5', 'n1-4'])
ax.set_yticks(y)
ax.set_yticklabels(['', 'p3', 'p5', 'p1-2', 'p4', ''])
for gx in range(grid_step, w + 1, grid_step):
ax.axvline(x=gx, color='gray', linestyle='dotted')
for gy in range(grid_step, h + 1, grid_step):
ax.axhline(y=gy, color='gray', linestyle='dotted')
ax.text(x[1]+20, y[1], "A")
ax.text(x[2]+20, y[2], "B")
ax.text(x[3]+15, y[3]-15, "C")
ax.text(x[4]+15, y[4]-15, "D,E")
ax.text(x[5]-10, y[5]-15, "F")
ax.plot(x, y, linewidth=5, marker='o')
ax.set_xlabel("Negatives")
ax.set_ylabel("Positives")
plt.show()