2.1 Decision Tree
2.2 Covarage
import matplotlib.pyplot as plt
import numpy as np

h = 50
w = 50
grid_step = 10

TP1 = 30
FP1 = 10
TP2 = 20
FP2 = 20

fig, ax = plt.subplots(figsize=(6, 6))
ax.set_xlim(0, w)
ax.set_ylim(0, h)
ax.set_xlabel("Negatives")
ax.set_ylabel("Positives")

ax.set_yticks([0, TP2, TP1, h])
ax.set_yticklabels(['0', 'TP2', 'TP1', 'Pos'])
ax.set_xticks([0, FP1, FP2, w])
ax.set_xticklabels(['0', 'FP1', 'FP2', 'Neg'])

for gx in range(grid_step, w, grid_step):
    ax.axvline(x=gx, color="gray", linestyle="--")

for gy in range(grid_step, h, grid_step):
    ax.axhline(y=gy, color="gray", linestyle="--")


col1 = "blue"
ax.plot(FP1, TP1, 'o', color=col1)
ax.text(FP1, TP1, "C1", color=col1, verticalalignment='bottom', horizontalalignment='center')

col2 = "red"
ax.plot(FP2, TP2, 'o', color=col2)
ax.text(FP2, TP2, "C2", color=col2, verticalalignment='bottom', horizontalalignment='center')

ax.axhline(y=TP1, color=col1, linestyle="--")
ax.axvline(x=FP1, color=col1, linestyle="--")

ax.axhline(y=TP2, color=col2, linestyle="--")
ax.axvline(x=FP2, color=col2, linestyle="--")

plt.show()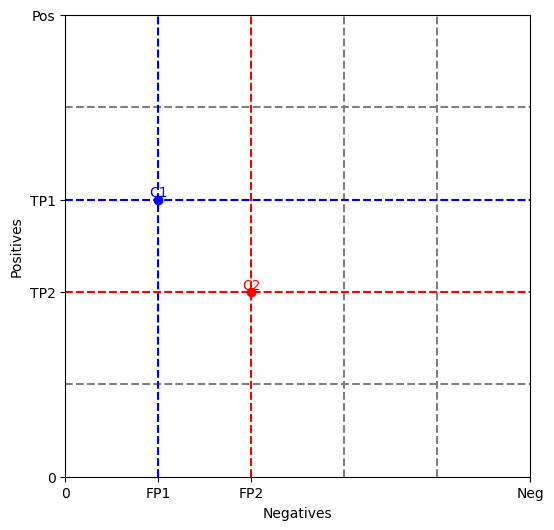
import matplotlib.pyplot as plt

h = 750
w = 250
grid_step = 50

TP3 = 600
FP3 = 100

fig, ax = plt.subplots()
ax.set_xlim(0, w)
ax.set_ylim(0, h)
ax.set_xlabel("Negatives")
ax.set_ylabel("Positives")

ax.set_xticks([0, FP3, w])
ax.set_xticklabels([0, "FP3", "Neg"])
ax.set_yticks([0, TP3, h])
ax.set_yticklabels([0, "TP3", "Pos"])

gx = grid_step
while gx <= w:
    ax.axvline(x=gx, color='gray', linestyle='dotted')
    gx += grid_step

gy = grid_step
while gy <= h:
    ax.axhline(y=gy, color='gray', linestyle='dotted')
    gy += grid_step

col3 = "green"
ax.plot(FP3, TP3, marker='o', color=col3)
ax.text(FP3, TP3, "C3", verticalalignment='bottom', horizontalalignment='center')
ax.axhline(y=TP3, color=col3, linestyle='dotted')
ax.axvline(x=FP3, color=col3, linestyle='dotted')

plt.show()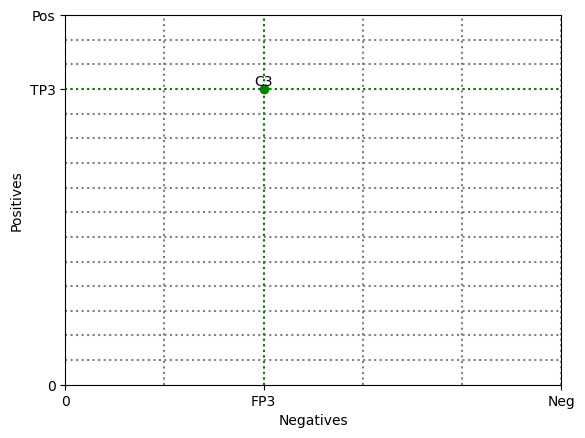
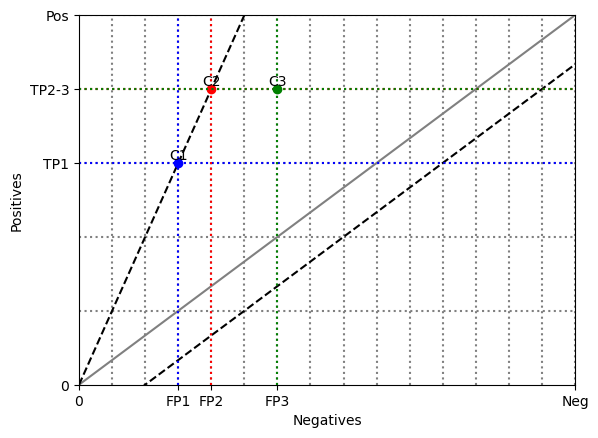
2.5 Covroc
import matplotlib.pyplot as plt
import numpy as np

h = 25
w = 75
grid_step = 5

TP1 = 15
FP1 = 15
TP2 = 20
FP2 = 20
TP3 = 20
FP3 = 30

fig, ax = plt.subplots()
ax.set_xlim(0, w)
ax.set_ylim(0, h)
ax.set_xticks([0, FP1, FP2, FP3, w])
ax.set_xticklabels(['0', 'FP1', 'FP2', 'FP3', 'Neg'])
ax.set_yticks([0, TP1, TP2, h])
ax.set_yticklabels(['0', 'TP1', 'TP2-3', 'Pos'])

for gx in range(grid_step, w + 1, grid_step):
    ax.axvline(x=gx, linestyle='dotted', color='gray')
for gy in range(grid_step, h + 1, grid_step):
    ax.axhline(y=gy, linestyle='dotted', color='gray')

x_diag = np.array([0, w])
y_diag = (h / w) * x_diag
ax.plot(x_diag, y_diag, color='gray')

x_diag2 = np.array([0, w])
y_diag2 = x_diag2
ax.plot(x_diag2, y_diag2, linestyle='dashed', color='black')

x_diag3 = np.array([0, w])
y_diag3 = (h / w) * (x_diag3 - 10)
ax.plot(x_diag3, y_diag3, linestyle='dashed', color='black')

ax.plot(FP1, TP1, marker='o', color='blue')
ax.text(FP1, TP1, "C1", va='bottom', ha='center')
ax.axhline(y=TP1, color='blue', linestyle='dotted')
ax.axvline(x=FP1, color='blue', linestyle='dotted')

ax.plot(FP2, TP2, marker='o', color='red')
ax.text(FP2, TP2, "C2", va='bottom', ha='center')
ax.axhline(y=TP2, color='red', linestyle='dotted')
ax.axvline(x=FP2, color='red', linestyle='dotted')

ax.plot(FP3, TP3, marker='o', color='green')
ax.text(FP3, TP3, "C3", va='bottom', ha='center')
ax.axhline(y=TP3, color='green', linestyle='dotted')
ax.axvline(x=FP3, color='green', linestyle='dotted')

ax.set_xlabel("Negatives")
ax.set_ylabel("Positives")
plt.show()
import matplotlib.pyplot as plt
import numpy as np

h = 75
w = 75
grid_step = 15

tpr1 = 45
fpr1 = 15
tpr2 = 60
fpr2 = 20
tpr3 = 60
fpr3 = 30

fig, ax = plt.subplots()
ax.set_xlim(0, w)
ax.set_ylim(0, h)
ax.set_xticks([0, fpr1, fpr2, fpr3, w])
ax.set_xticklabels(['0', 'fpr1', 'fpr2', 'fpr3', 'Neg'])
ax.set_yticks([0, tpr1, tpr2, h])
ax.set_yticklabels(['0', 'tpr1', 'tpr2-3', 'Pos'])

for gx in range(grid_step, w + 1, grid_step):
    ax.axvline(x=gx, linestyle='dotted', color='gray')
for gy in range(grid_step, h + 1, grid_step):
    ax.axhline(y=gy, linestyle='dotted', color='gray')

x_diag = np.array([0, w])
y_diag = (h / w) * x_diag
ax.plot(x_diag, y_diag, color='gray')

x_diag2 = np.array([0, w])
y_diag2 = 3 * x_diag2
y_diag2_shifted = 3 * (x_diag2 - 30)
ax.plot(x_diag2, y_diag2_shifted, linestyle='dashed', color='black')
ax.plot(x_diag2, y_diag2, linestyle='dashed', color='black')

ax.plot(fpr1, tpr1, marker='o', color='blue')
ax.text(fpr1, tpr1, "C1", va='bottom', ha='center')
ax.axhline(y=tpr1, color='blue', linestyle='dotted')
ax.axvline(x=fpr1, color='blue', linestyle='dotted')

ax.plot(fpr2, tpr2, marker='o', color='red')
ax.text(fpr2, tpr2, "C2", va='bottom', ha='center')
ax.axhline(y=tpr2, color='red', linestyle='dotted')
ax.axvline(x=fpr2, color='red', linestyle='dotted')

ax.plot(fpr3, tpr3, marker='o', color='green')
ax.text(fpr3, tpr3, "C3", va='bottom', ha='center')
ax.axhline(y=tpr3, color='green', linestyle='dotted')
ax.axvline(x=fpr3, color='green', linestyle='dotted')

ax.set_xlabel("Negatives")
ax.set_ylabel("Positives")
plt.show()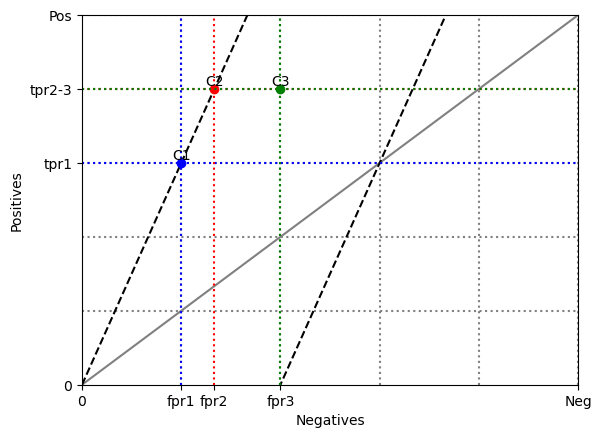
2.7 Covrank
import matplotlib.pyplot as plt

h = 500
w = 500
grid_step = 10

fig, ax = plt.subplots()
ax.set_xlim(0, w)
ax.set_ylim(0, h)
ax.set_xticks([0, w])
ax.set_xticklabels(['0', 'Neg'])
ax.set_yticks([0, h])
ax.set_yticklabels(['0', 'Pos'])

x = [0, w/3, 2*w/3, w]
y = [0, h/3, 2*h/3, h]

for i in range(3):
    for j in range(3):
        if i < j:
            color = 'red'
        elif i == j:
            color = 'orange'
        else:
            color = 'green'
        ax.add_patch(plt.Rectangle((x[i], y[j]), x[i+1]-x[i], y[j+1]-y[j], color=color))

x_curve = [0, 50, 100, 500]
y_curve = [0, 200, 300, 500]
ax.plot(x_curve, y_curve, linestyle='dashed', color='black')

for gx in range(grid_step, w + 1, grid_step):
    ax.axvline(x=gx, linestyle='dotted', color='gray')
for gy in range(grid_step, h + 1, grid_step):
    ax.axhline(y=gy, linestyle='dotted', color='gray')

ax.set_xlabel("Negatives sorted on decreasing score")
ax.set_ylabel("Positives sorted on decreasing score")
plt.show()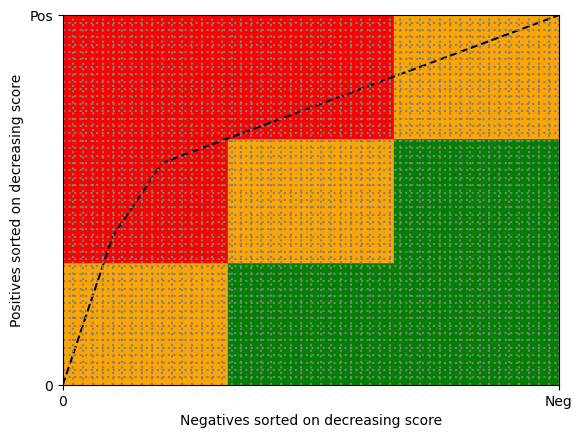
import matplotlib.pyplot as plt

h = 500
w = 500
grid_step = 50

fig, ax = plt.subplots()
ax.set_xlim(0, w)
ax.set_ylim(0, h)
ax.set_xticks([0, 50, 100, 500])
ax.set_xticklabels(['0', 'FP1', 'FP2', 'Neg'])
ax.set_yticks([0, 200, 300, 500])
ax.set_yticklabels(['0', 'TP1', 'TP2', 'Pos'])

x = [0, 50, 100, 500]
y = [0, 200, 300, 500]

for gx in range(grid_step, w + 1, grid_step):
    ax.axvline(x=gx, linestyle='dotted', color='gray')
for gy in range(grid_step, h + 1, grid_step):
    ax.axhline(y=gy, linestyle='dotted', color='gray')

ax.text(x[0]+10, y[0]+10, "A")
ax.text(x[1]+10, y[1], "B")
ax.text(x[2]+10, y[2], "C")
ax.text(x[3]-10, y[3]-15, "D")

for i in [1, 2]:
    ax.axvline(x=x[i], linestyle='dashed', color='black')
    ax.axhline(y=y[i], linestyle='dashed', color='black')

ax.plot(x, y, linestyle='solid', marker='o', color='black')
ax.set_xlabel("Negatives")
ax.set_ylabel("Positives")
plt.show()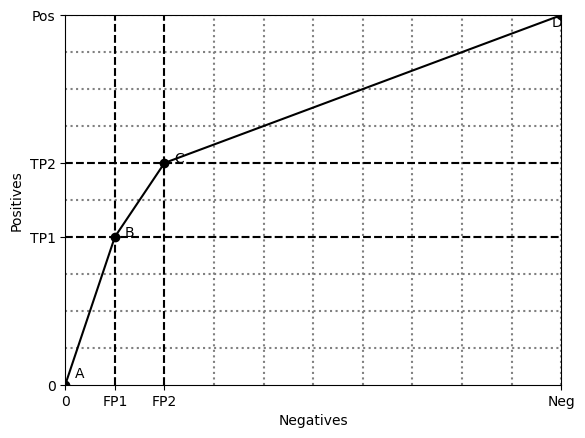
2.8 Racc Unbalanced
import matplotlib.pyplot as plt
import numpy as np

h = 500
w = 1000
grid_step = 50

x = [0, 100, 200, 1000]
y = [0, 200, 300, 500]

fig, ax = plt.subplots()
ax.set_xlim(0, w)
ax.set_ylim(0, h)

ax.set_xticks(x)
ax.set_xticklabels(['0', 'FP1', 'FP2', 'Neg'])
ax.set_yticks(y)
ax.set_yticklabels(['0', 'TP1', 'TP2', 'Pos'])

for gx in range(grid_step, w + 1, grid_step):
    ax.axvline(x=gx, color='gray', linestyle='dotted')
for gy in range(grid_step, h + 1, grid_step):
    ax.axhline(y=gy, color='gray', linestyle='dotted')

for i in [1, 2]:
    ax.axvline(x=x[i], linestyle='dashed')
    ax.axhline(y=y[i], linestyle='dashed')

ax.plot(x, y, marker='o', linestyle='solid')

ax.set_xlabel("Negatives")
ax.set_ylabel("Positives")
plt.show()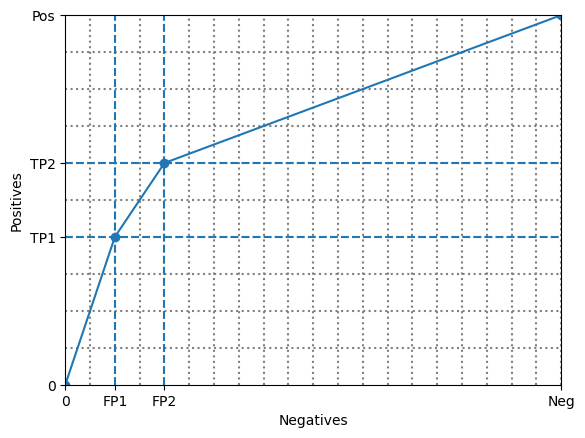
2.9 Covgrad
import matplotlib.pyplot as plt
import matplotlib.patches as patches

ranking = [1,1,1,0,1,0,0,1,0,0]
x = [0,0,0,0,100,100,200,300,300,400,500,500]
y = [0,100,200,300,300,400,400,400,500,500,500,500]

h = 500
w = 500
grid_step = 100

fig, ax = plt.subplots()
ax.set_xlim(0, w)
ax.set_ylim(0, h)
ax.set_xticks(x[:-1])
ax.set_xticklabels(['','','','','n1','','n2','n3','','n4','n5'])
ax.set_yticks(y[:-1])
ax.set_yticklabels(['','p1','p2','p3','','p4','','','p5','',''])

for gx in range(grid_step, w + 1, grid_step):
    ax.axvline(x=gx, color='gray', linestyle='dotted')
for gy in range(grid_step, h + 1, grid_step):
    ax.axhline(y=gy, color='gray', linestyle='dotted')

for i in range(11):
    for j in range(11):
        if i < j:
            color = 'red'
        elif i == j:
            color = 'orange'
        else:
            color = 'green'
        rect = patches.Rectangle((x[i], y[j]), x[i+1]-x[i], y[j+1]-y[j], facecolor=color)
        ax.add_patch(rect)

ax.set_xlabel("Negatives")
ax.set_ylabel("Positives")
plt.show()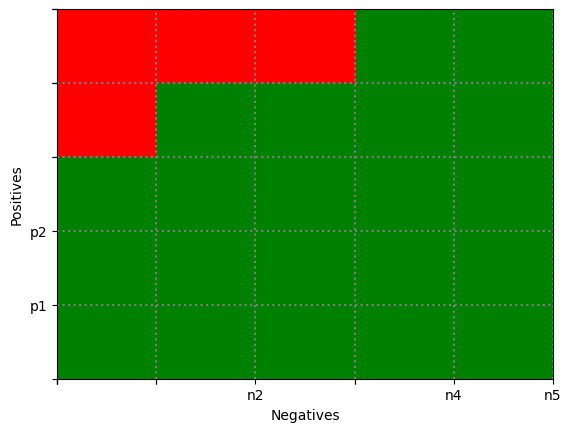
2.13 Convexhull
import matplotlib.pyplot as plt

ranking = [1, 1, 1, 0, 1, 0, 0, 1, 0, 0]
x = [0, 0, 0, 300, 300, 300, 600, 600, 600, 900, 1200]
y = [0, 200, 400, 400, 600, 800, 800, 1000, 1200, 1200, 1200]

h = 1200
w = 1200
grid_step = 120

fig, ax = plt.subplots()
ax.set_xlim(0, w)
ax.set_ylim(0, h)

ax.set_xticks([0, 120, 240, 360, 480, 600, 720, 840, 960, 1080, 1200])
ax.set_xticklabels(['', '', '', '0.25', '', '', '0.50', '', '', '0.75', '1.00'])

ax.set_yticks([0, 120, 240, 360, 480, 600, 720, 840, 960, 1080, 1200])
ax.set_yticklabels(['', '0.17', '0.33', '', '0.50', '0.67', '', '0.83', '1.00', '', ''])

for gx in range(grid_step, w + 1, grid_step):
    ax.axvline(x=gx, color='gray', linestyle='dotted')
for gy in range(grid_step, h + 1, grid_step):
    ax.axhline(y=gy, color='gray', linestyle='dotted')

ax.plot(x, y, linestyle='dashed', marker='o')

ax.plot([x[0], x[2]], [y[0], y[2]], color='red', linewidth=4)
ax.plot([x[2], x[8]], [y[2], y[8]], color='red', linewidth=2)
ax.plot([x[8], x[10]], [y[8], y[10]], color='red', linewidth=4)

ax.set_xlabel("False positive rate")
ax.set_ylabel("True positive rate")
plt.show()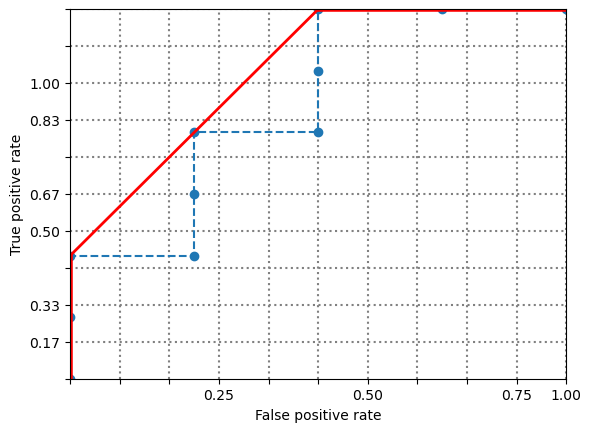
2.12 Pet
import matplotlib.pyplot as plt

x = [13, 24, 32, 42, 49, 63, 71, 74, 80, 89]
y = [0, 0, 67, 67, 67, 67, 67, 67, 100, 100]
y1 = [33, 33, 60, 60, 60, 60, 60, 60, 67, 67]

h = 100
w = 100
grid_step = 10
lwd = 2

fig, ax = plt.subplots()
ax.set_xlim(0, w)
ax.set_ylim(0, h)

ax.set_xticks(x)
ax.set_xticklabels([v / 100 for v in x])
ax.set_yticks(range(0, h + 1, grid_step))
ax.set_yticklabels([v / 100 for v in range(0, h + 1, grid_step)])

for gx in range(grid_step, w + 1, grid_step):
    ax.axvline(x=gx, color='gray', linestyle='None')
for gy in range(grid_step, h + 1, grid_step):
    ax.axhline(y=gy, color='gray', linestyle='None')

ax.plot(x, y, marker='o', linestyle='None', color='red')
ax.plot([0, x[1]], [y[0], y[1]], linewidth=4, color='red')
ax.plot([x[1], x[2]], [y[1], y[2]], linewidth=lwd, color='red')
ax.plot([x[2], x[7]], [y[2], y[7]], linewidth=lwd, color='red')
ax.plot([x[7], x[8]], [y[7], y[8]], linewidth=lwd, color='red')
ax.plot([x[8], 100], [y[8], y[9]], linewidth=4, color='red')

ax.plot(x, y1, marker='o', linestyle='None', color='blue')
ax.plot([0, x[1]], [y1[0], y1[1]], linestyle='dashed', linewidth=lwd, color='blue')
ax.plot([x[1], x[2]], [y1[1], y1[2]], linestyle='dashed', linewidth=lwd, color='blue')
ax.plot([x[2], x[7]], [y1[2], y1[7]], linestyle='dashed', linewidth=lwd, color='blue')
ax.plot([x[7], x[8]], [y1[7], y1[8]], linestyle='dashed', linewidth=lwd, color='blue')
ax.plot([x[8], 100], [y1[8], y1[9]], linestyle='dashed', linewidth=lwd, color='blue')

ax.set_xlabel("Original score")
ax.set_ylabel("Calibrated probability")
plt.show()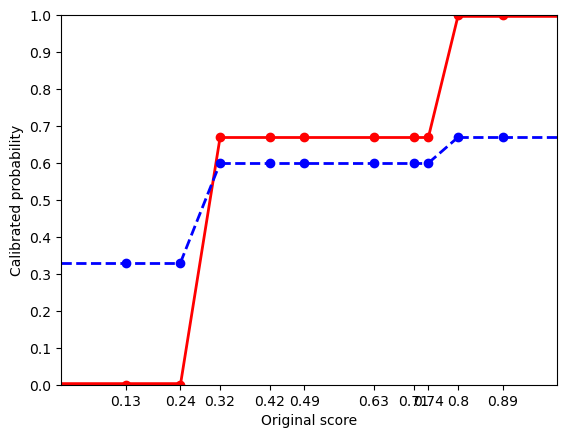
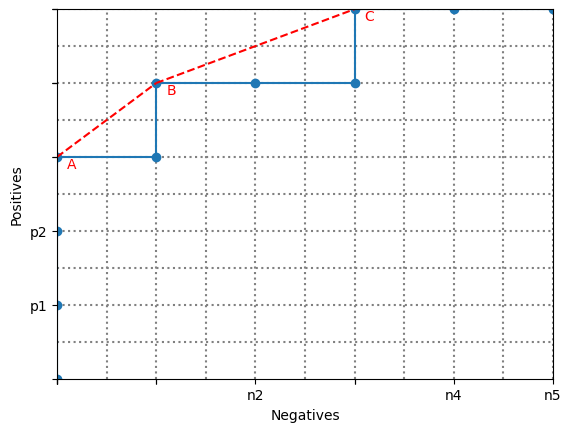
Covgrad 2
import matplotlib.pyplot as plt

ranking = [1,1,1,0,1,0,0,1,0,0]
x = [0,0,0,0,100,100,200,300,300,400,500]
y = [0,100,200,300,300,400,400,400,500,500,500]

h = 500
w = 500
grid_step = 50

fig, ax = plt.subplots()
ax.set_xlim(0, w)
ax.set_ylim(0, h)
ax.set_xticks(x)
ax.set_xticklabels(['','','','','n1','','n2','n3','','n4','n5'])
ax.set_yticks(y)
ax.set_yticklabels(['','p1','p2','p3','','p4','','','p5','',''])

for gx in range(grid_step, w + 1, grid_step):
    ax.axvline(x=gx, color='gray', linestyle='dotted')
for gy in range(grid_step, h + 1, grid_step):
    ax.axhline(y=gy, color='gray', linestyle='dotted')

ax.text(x[3]+10, y[3]-15, "A", color="red")
ax.text(x[5]+10, y[5]-15, "B", color="red")
ax.text(x[8]+10, y[8]-15, "C", color="red")

ax.plot(x, y, linestyle='solid', marker='o')
ax.plot([x[3], x[5]], [y[3], y[5]], linestyle='dashed', color="red")
ax.plot([x[5], x[8]], [y[5], y[8]], linestyle='dashed', color="red")

ax.set_xlabel("Negatives")
ax.set_ylabel("Positives")
plt.show()